What Happened to my Time
Academic Time
When I began my first academic post at a UK university after completing my PhD, I quickly realised how easily time could slip away. Teaching, marking, research, supervision, administrative tasks, and endless emails left me at the end of each week wondering where my effort had gone and how productive I had truly been.
Encountering R (with Skepticism)
Around that time, I also started learning R. At first, it felt like an impossible challenge, like a daunting first date: intimidating, awkward, weird, etc… R was unlike the languages I was used to, such as C, C++, or Java, with a completely different way of thinking and interactive coding. Despite this, I decided to give it a shot.
Progress was slow in the beginning. The learning curve felt steep, and there were plenty of moments when my motivation wobbled. Looking back, it’s probably a familiar experience for anyone learning R, or anything else, especially outside their comfort zone, for the first time: curious, but not yet convinced the effort would pay off.
Learning by Doing
To push myself and stay motivated, I chose to build something genuinely useful rather than just following tutorials: a simple R app to log and track my daily activities, teaching, marking, second marking, and more, with minimal effort.
This project forced me to learn R practically, and slowly, it clicked. I ended up loving the language and began doing almost everything in R, my CV, lecture notes, and much more. I especially enjoyed the ability to combine notes, code, and output in one place (reproducible and interactive document, .rnw files). I later shared this approach with students through a project template, which remains available here: Project Template on GitHub
Most importantly, I built a simple yet highly effective R app (not sure if I can call it app), but with powerful features for logging and visualising my work activities. I can’t stress enough the value of learning by doing. The moment I started building even this basic app, my mindset shifted from “I want to learn more, read more, watch more” to “I want to do more.”
That shift made all the difference. Building something tangible created momentum, curiosity, and confidence. Each small improvement pushed me to explore new ideas naturally, not because I felt I should learn more, but because I genuinely wanted to improve my basic app.
What the Data Revealed
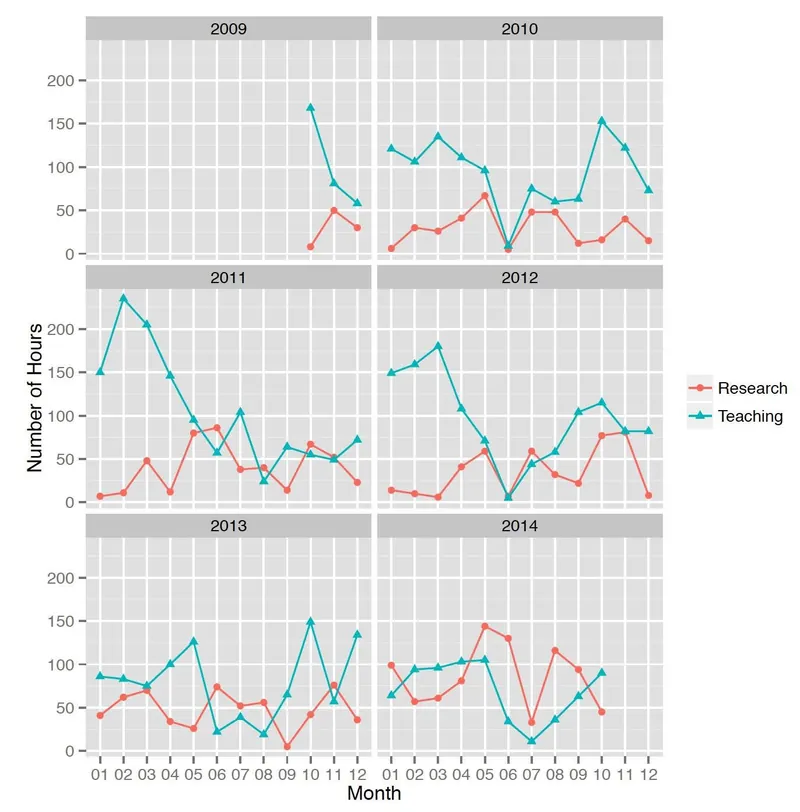
Over the months and years, watching plots like the one above evolve gave me far more insight than I anticipated. Clear patterns in my workload emerged, revealing how easily research time could be crowded out. Gradually, I learned to deliberately block time for research, protecting it, and to make intentional choices about how I worked. The data enabled better planning, honest self-reflection, and more confident conversations about workload. What once felt impossible had become a trusted daily tool.
Lessons Learned
Main lessons stand out from this experience.
Time: This experience taught me several important lessons: first, time is an irreplaceable resource, and without actively measuring and monitoring it, progress becomes guesswork and leads nowhere.
Do it: Second, the fastest way to learn is by building something real, applying new tools to concrete problems, even in imperfect or simple ways, helps develop strong and lasting habits. For example, when learning machine learning, tutorials and books are helpful, but true understanding comes from putting concepts into practice.
R: Finally, for those without an AI background, learning R is a great choice, particularly in today’s era of AI and large language models. It is great for data analytics, visualisation, and much more. A great starting point would be the Book Introduction to Statistical Learning with Application in R. You can check it online with a set of lectures by the author available Online.